Update: December 2024, complete overhaul of the article to change from Universal Analytics (GA3) to Google Analytics 4 (GA4).
What is the first thing that comes to your mind when you hear about Google Analytics?
For most people, it probably has something to do with Search Engine Optimisation (SEO), but did you know that tools like Google Analytics (GA) also hold tons of insights into how you can create better content for your business?
To save time and money for your company, don’t you think it would be better if you could create better content instead of more content?
Quality over quantity and better content that resonates deeply with your target audience help you rank higher for the search terms you want to be found for. Instead of just trying to create as much content as possible, hoping you eventually will rank?
There are dozens of different ways to slice and dice all the information available in Google Analytics to create killer content ideas for your website or social media marketing. To help you get the most out of your valuable time and to help guide you to improve your content marketing performance, this post will help you set up your Google Analytics. We also discuss the most common terminologies you need to navigate through all the reports and drive your content strategy.
However, Google has migrated its system from Universal Analytics to Google Analytics 4 (GA4). We will learn the differences between its search engine optimization features and content analytics platform.
First, let’s figure out why you should take the time to learn how to use Google Analytics in Content Marketing.
- Identify which content resonates most with your audience.
- Optimize pages for better performance and higher conversions.
- Track user behavior across the entire customer journey.
- Align content with strategic goals using advanced reporting tools like Explorations and BigQuery.
Want to dive deeper? Keep reading to discover step-by-step guides and actionable insights for using GA4 to transform your content strategy.
Table of Contents
- Why is Google Analytics important for content marketing?
- Implementing Google Analytics on your site
- Google Analytics 4 Terminology
- What is a User within Google Analytics 4?
- What are Pageviews?
- What are Unique Pageviews?
- What are Engaged Sessions in Google Analytics 4?
- How are Pageviews combined into Sessions?
- What is Bounce Rate?
- What is Engagement Rate in Google Analytics 4?
- What is the Acquisition Report in Google Analytics
- What is a Referral in Google Analytics
- What are UTM Tags
- Turning Google Analytics into valuable, actionable information
- Using Real-Time Reporting in Google Analytics 4
- What Can You See in Real-Time Reports?
- How to Use Real-Time Reports
- Why Real-Time Reporting Matters for Content Marketing
- Setting up conversions for important conversions on your site.
- Aligning your goals across the Customer Journey to what you can track
- Using Site Search
- Identifying and Filtering Internal Traffic from Google Analytics
- See which pages hold people’s attention the longest.
- Finding slow loading page to optimize your site speed
- Finding Slow-Loading Pages and Tracking Core Web Vitals
- Advanced Google Analytics reporting
Why is Google Analytics important for content marketing?
If You Can't Measure It, You Can't Improve It. - Peter DruckerClick To TweetManagement thinker Peter Drucker was right. For you to improve any part of your business, you need to be able to measure it and optimize content. And what easier way to measure than using a content analytics tool that offers incredible reporting features at no cost from a company that is already collecting vast amounts of data from your company and your customers?
By reading the numbers, Google Analytics can capture your business and try to figure out the story they are trying to tell you is THE best way to make data-informed marketing decisions and improve your marketing performance in general.
Let’s say, for example, you’ve got an idea to create content for your page. You assume this is the material your customers are waiting for. After all, great content marketing is about solving the same problems that your product solves through the media you create and promote, right?
So, you research online, start creating what you think is the absolute best content around the subject you’ve ever seen, and hit that publish button.
If you don’t have any analytics help, your story will end there. Your content is online, and you’re hoping for the best. Maybe you would see new leads coming in, but that’s it.
By using analytics (and Google Analytics is one of the best, easiest, and free tools available), you would not only know if your content creation process is hitting the marks, but you can also figure out the rest of the story.
What individual pieces led up to that conversion to the people coming to your site?
It doesn’t only help you to establish your goals. It can help you learn how to repeat the process in the most efficient ways, come up with new content topics, maybe learn how you need to make adjustments to your content so it hits the mark, etc.
Not only that, Google Analytics can help you answer questions like:
- How effective are my Content Marketing objectives?
- What are the pieces of content that are the least effective and turn visitors away?
- Are my marketing efforts improving over time?
- Which types of content are most effective for converting visitors? Which content creation process is most effective in building traffic?
- What are some content topics that I’m missing out on?
- What are some quick wins that my marketing team can implement?
You see, the better your data and analytics, the more data-driven decisions you can make about your content marketing strategy and how to move forward.
Implementing Google Analytics on your site
Now that you know the importance of measuring your Content Marketing goals with Google Analytics, let’s dive into the basics to help you get started. Remember that Google Analytics 4 (GA4) is now used instead of Universal Analytics.
Creating a Google Analytics account
First things first, before you can use Google Analytics, you have to set up Google Analytics on your website, of course.
If you don’t already have a Google Analytics account, you can quickly create one for free on the Google Analytics website!
To create a Google Analytics account:
- Click here to go to Google Analytics. Note: If you have a Google account and are not signed in, click Sign in. If you do not have a Google account, click Create an account.
- Once you have signed in to Google, click Start Measuring to begin setting up your Google Analytics account.
- Now, you have to set up your details under Account Creation. Enter an account name in the space provided. This could either be your business or website name. Also confirm your data-sharing settings from the options below based on your preferences.
- The next page is to Create a Property. Enter a Property Name for the website or app you want to track. Remember to choose the correct Reporting Time Zone and Currency for accurate reports.
- The next page is for Business Details. Select the correct Industry Category from the drop-down menu. You also have to choose the correct Business Size range and click Next.
- You should see a list of topics: Leads, Sales, Traffic, User engagement & retention, and Other. Select the topics that most align with your business objectives. Click on Create when you are done.
- Next, tick the box and click “I Accept” on the next page for the Google Analytics Terms of Service Agreement.
- You’ll see a new Measurement ID instead of the Tracking ID used in Universal Analytics. Write down the Measurement ID for setup on your website. The ID looks like G-XXXXXXXXXX.
Installing Google Analytics 4 using Google Tag Manager
The next thing you have to do is set up Google Analytics 4 on your website. There are three different ways to do this, especially if you run WordPress like us:
- Implement the Measurement ID manually in your WordPress theme (only if you know how to code; ask your developer otherwise).
- Use a plugin like Monster Insights to add the GA4 Measurement ID and basic tracking functionality to your website quickly.
- Take a little longer approach by using Google Tag Manager (GTM) to implement the GA4 Measurement ID.
Note: The GA4 Measurement ID was the Tracking ID under Universal Analytics.
Of these three options above, we prefer the last method of using GTM to set up GA4.
Google Tag Manager not only allows you to implement Google Analytics on your website, but it also gives an easy way to deploy and manage all other marketing tags (snippets of code or tracking pixel, think Facebook Pixel, Snapchat pixel, etc.) to your website without needing a developer at all.
So, head over to Google Tag Manager and sign up. The next step is creating a new account by entering an account name and location. Thereafter, you enter the name of your website as the Container Name and select Web as the place to use the container.
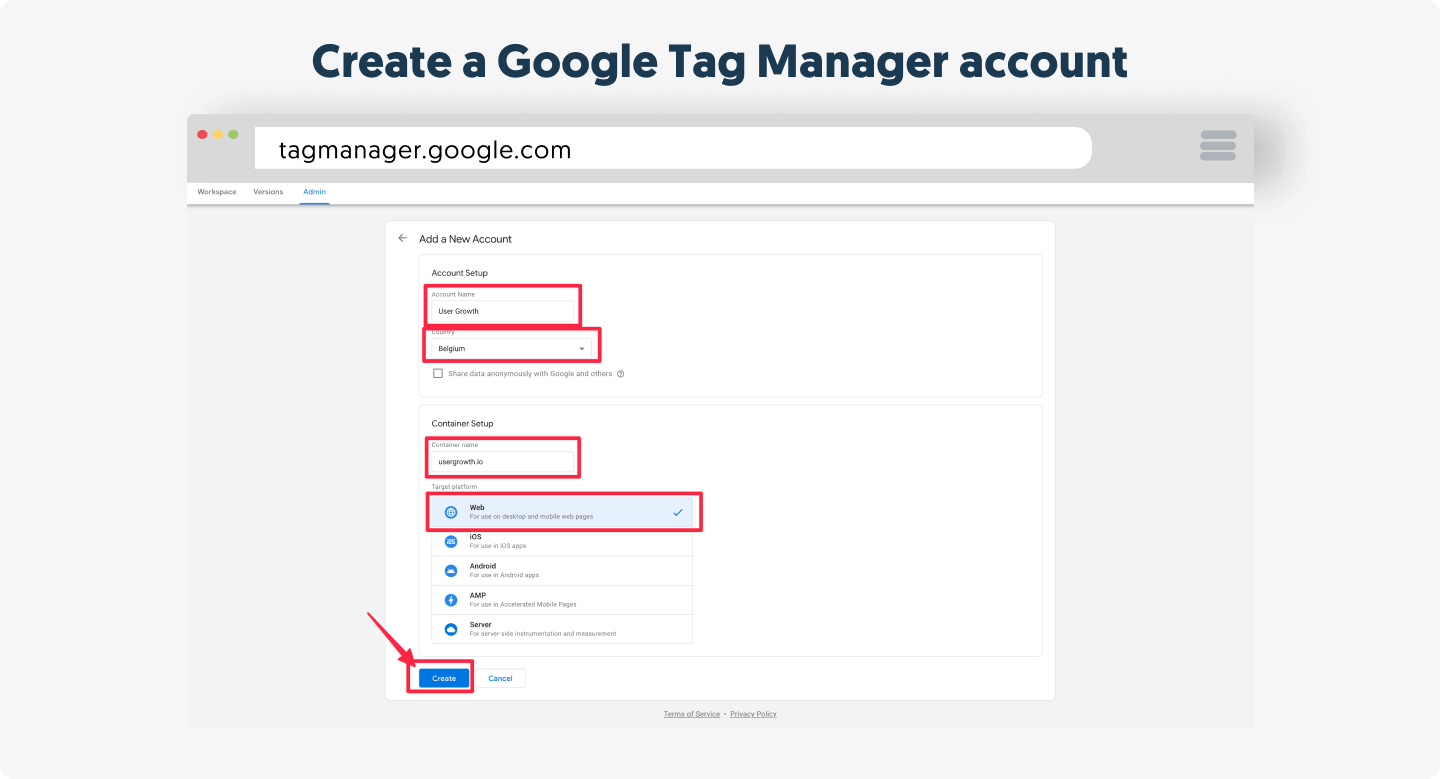
Pretty straightforward, right?
Now, accept the Terms of Services of Google Tag Manager, and you’re almost ready.
Copy the GTM container code and then, most importantly, the Google Tag Manager ID (looks like GTM-XXXXXXX).
Using the Google Tag Manager for WordPress plugin, you don’t need to edit any code. Just install the plugin and activate it. Next, copy and paste the Google Tag Manager ID into the plugin’s settings.
Now we need to add a tag to the Google Tag Manager, do this by signing in to your Google Account at Google Tag Manager. Select the Accounts tab and choose your container. The next step is to locate the Workspaces tab, go to Tags, and then click New.
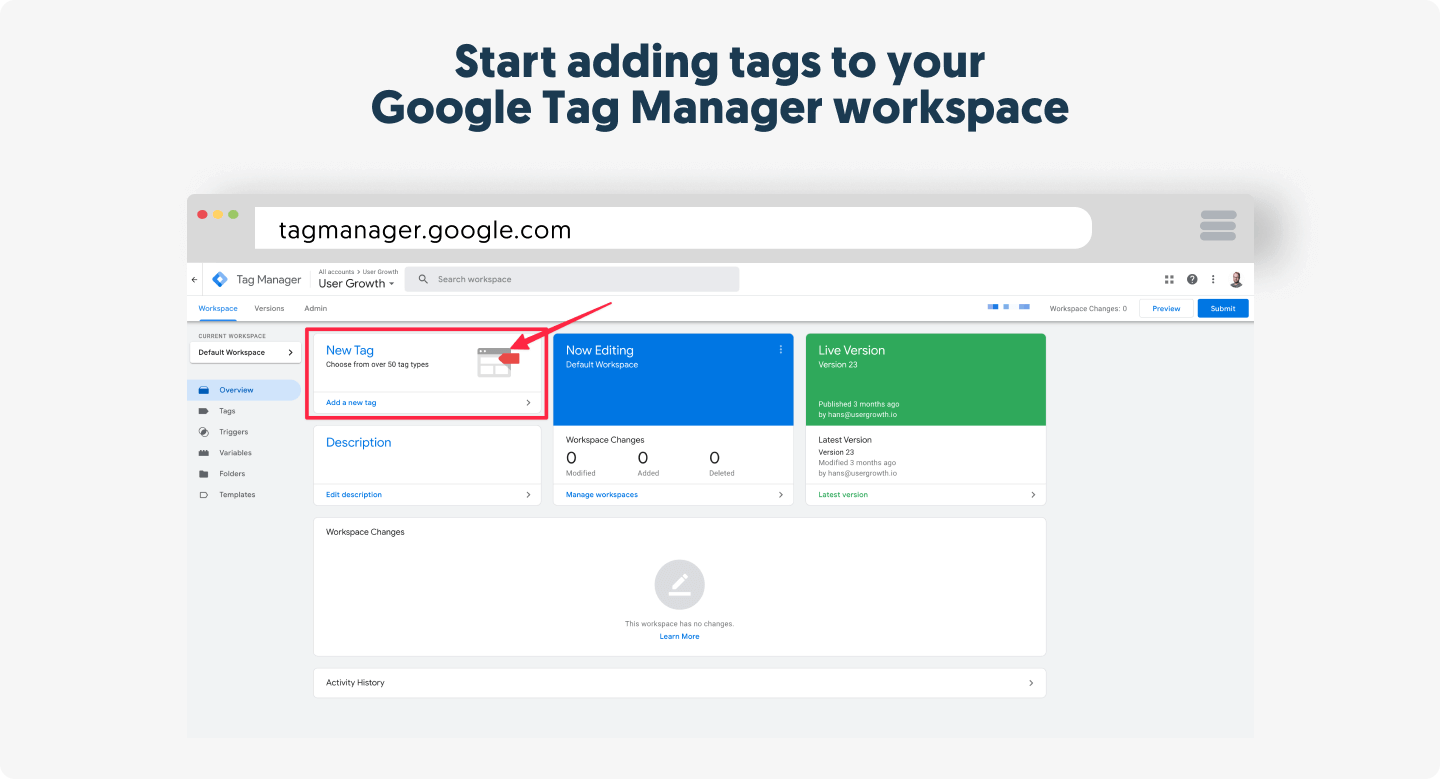
Then you need to create a name so the tag is easily recognizable for future use. We suggest using “Google Analytics,” but you can use whatever you want.
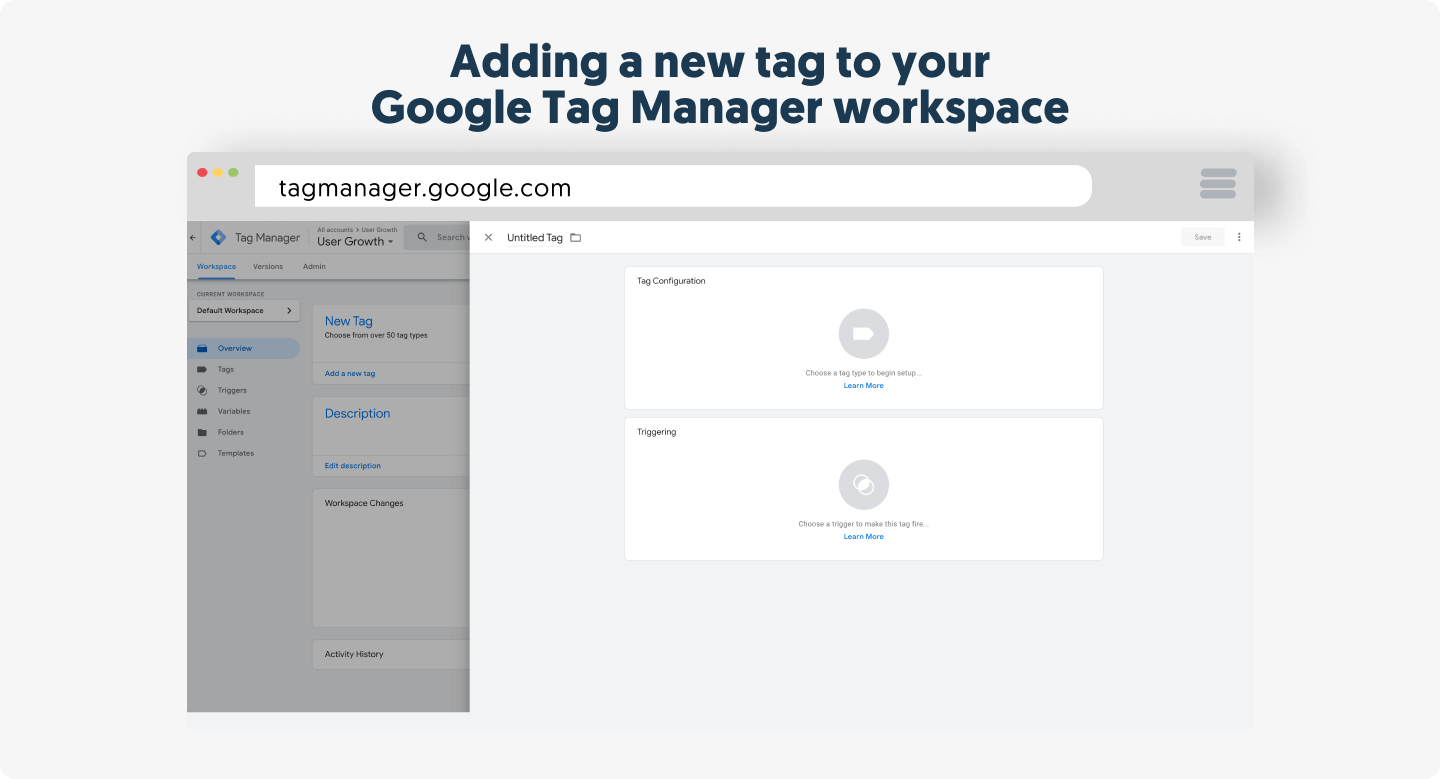
Name the tag, choose the tag type Google Analytics, and then select “Google Analytics: GA4 Event”.
In the next screen, you can enter your GA4 Measurement ID from the Google Analytics you set up earlier. Google Tag Manager asks you to name the event for later use in other places. Let’s keep that name as it is.
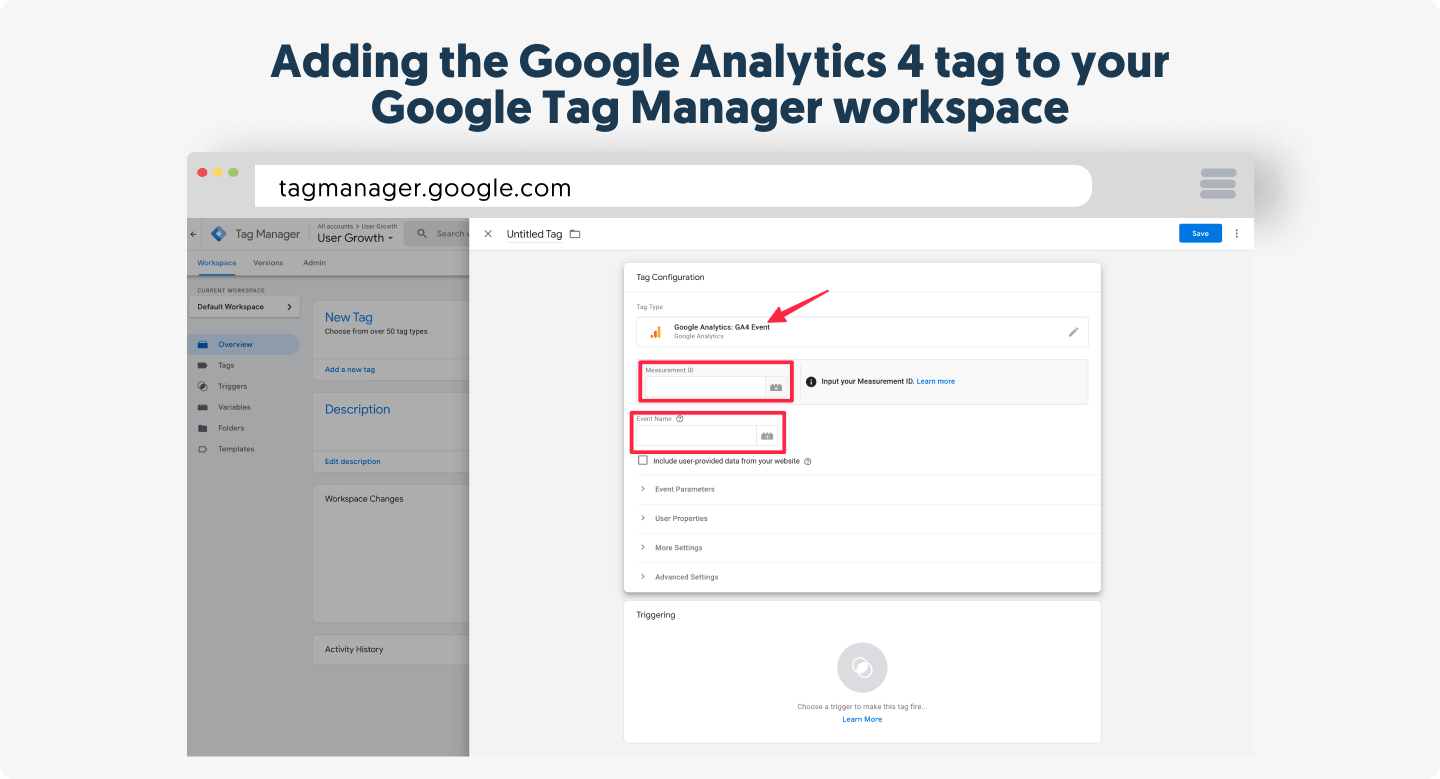
Next, set up the trigger to fire the tag on all pages. The final step now to have Google Analytics working on your website and have it execute on every page is hitting the Submit Button (top-right corner)

Give your changes a version name and hit publish. When Google Tag Manager for WordPress is activated with your Google Tag Manager ID, Google Analytics will now work on your site.
Google Analytics 4 Terminology
Before we go any deeper, let’s first get the fundamental terminology right. Since migrating from Universal Analytics, GA4 has introduced some new ways to measure content, define user interactions, and track them.
What is a User within Google Analytics 4?
One of the first things you need to know about Google Analytics as a marketer, business owner, or web developer is who is a “user” within GA4. For GA4, an individual who browses your website is called a user. (If you want to get really technical, it is a unique browser cookie). It does not matter whether a person visits your website only once or multiple times. For example, one user can create five sessions on your site, each with numerous page views.
Since GA4 uses a unique cookie to identify this person, a user is stored in a browser. When someone visits your website using different browsers (on the same machine or different devices), Google Analytics will report more than one user.
Unlike within Universal Analytics, GA4 has what we call Active Users and Total Users.
- Active Users: Individuals who had an engaged session, meaning they spent at least 10 seconds on your page, triggered an event, or viewed multiple pages.
- Total Users: This includes the total number of users who browsed your website, regardless of the type of engagement or time they spent on your page.
If you want to identify one person over multiple devices/browsers, use the User ID feature. A User ID is a way to combine sessions from a known person on your website. If you have a way to identify someone (by using an ID from your CRM system, for example), you can send that ID to GA4, which enables a unique set of cross-device reports. Of course, this works only accurately when you can identify a visitor (for example, when someone is logged into your marketing platform) and won’t work for all visitors.
This updated event-based tracking within GA4 will help you understand user engagement and identify which content resonates best for different users.
What are Pageviews?
A Pageview is precisely what you think it would mean. When a User views a page on your website, this will be reported as a Pageview (page_view). By default, Google Analytics 4 tracks each view as an event to capture the total amounts of page loads. This helps you to identify important web or social media analytics, such as which content of yours is viewed more than others.
What are Unique Pageviews?
The problem with Pageviews, though, is that if a User visits the same page multiple times within the same session, they are all counted as Pageviews. This means that when someone returns to a previous page after consuming a particular piece of content, the original page is recorded twice as being viewed. Even if the only reason to go back was that they knew there was another link there that they wanted to explore.
By looking at Unique Pageviews, every page is only counted once within a single session, even if it was viewed multiple times.
However, GA4 no longer includes the “Unique Pageviews” metric. Google Analytics 4 now uses an event-based approach instead of session-based metrics. So, we have Active Users and Engaged Sessions to track multiple user visits within GA4.
We already explained Active Users under our definition of a user in GA4. The following terminology to explain is Engaged Sessions.
What are Engaged Sessions in Google Analytics 4?
Engaged Sessions have replaced Unique Pageviews as necessary GA4 metrics for content creators to analyze the quality of their user interactions beyond pageviews count. We have an Engaged Session when the user does any of the following:
- Spend at least 10 seconds on your site
- Views two or more pages
- Triggers a conversion event
Altogether, it helps you measure the impact of your content in keeping users interested and engaged.
How are Pageviews combined into Sessions?
While Pageviews are interesting, figuring out how many Sessions there were on your website is always interesting. GA4, as a data analytics tool, also introduces “events” to define user interactions instead of just Sessions or Pageviews alone.
When someone opens an individual article on your blog, then moves on to the “Homepage” and afterward to your “About Us” page to find more information about your company, those three pages are combined into a Session on your website. Each page visit generates a page_view event but is still grouped under one Session.
So how does this compare to a User and Pageviews? When a person returns a couple of days later, and visits five more pages, five more pageviews are recorded in your reporting, and there is still only one User, but there are now two Sessions for that User.
What is Bounce Rate?
The definition of Bounce Rate has slightly changed from what it used to be under Universal Analytics. Before GA4, Bounce Rate was the percentage of sessions with only one single Pageview. The context of Bounce Rate was to measure your content performance and which pages deserve extra attention. After all, you want your visitors to get down the rabbit hole, consuming more and more content so they start to see your company’s value and turn into leads.
Bounce Rate also considers the type of page you are reporting on. For example, landing pages should have a lower Bounce Rate (because you want people to convert and move to the Thank You page) than maybe your Homepage or a Store Locator.
So, what changed about Bounce Rate in Google Analytics 4?
Beyond counting Sessions with only one Pageview, the Bounce Rate in GA4 is now the percentage of Sessions that were not engaged. That refers to the Sessions where the user spent less than 10 seconds, viewed only one page, or triggered no conversion rates.
A more comprehensive metric, the Engagement Rate, was introduced under GA4.
What is Engagement Rate in Google Analytics 4?
The Engagement Rate is the percentage of Engaged Sessions from the total Sessions. This marketing analytics metric provides a clearer view of how visitors interact with your content, focusing on genuinely interested users rather than those who visit a page and leave.
For example, if your site reported 1,000 Sessions and only 350 were engaged, the Engagement Rate would be 35%. On the other hand, the Bounce Rate (sessions not engaged) becomes an inverse of the Engagement Rate. Therefore, the Bounce Rate would be 65%.
What is the Acquisition Report in Google Analytics
To determine how people find your website, you will look at the Acquisition reports. The Acquisition Report shows you which marketing channels your visitors are coming from and gives you a report that shows the source, medium, and other acquisition dimensions. You can also see traffic from social networks and marketing and sales traffic from custom campaign tags.
When you link your Google Search Console and your Google Ads accounts to your Google Analytics 4 account, you can also get dedicated reports around paid traffic and organic traffic.
What is a Referral in Google Analytics
The Referral reports are on the same line as the Acquisition Reports. When someone arrives at your website from another third-party webpage, this will be reported as a Referral. In other words, all the sites that are sending you traffic (by domain) are listed here. If you want, you can drill it down to view the “Referral Path,” which gives you an overview of all the individual pages linking to your website.
One of the fundamental ways you need to start tracking all your Inbound Marketing activity (all the campaigns you’re doing on other places on the internet that will give traffic back to your website) is by using UTM tags.
You can add extra details at the end of a link you share (query parameters), which will be included in your Acquisition Reports.
UTM stands for “Urchin Tracking Module” (the company that invented them and got bought by Google, turning them into Google Analytics 4), and they are the things you can see after a URL in your browser. These extra details are always at the end of a URL you’re sharing and include things like “utm_campaign,” “utm_source,” “utm_medium,” “utm_term,” “utm_content” and “utm_id.”
Looking for a way to build UTM tracking URLs consistently? Use our free UTM Campaign URL builder.
Campaign Name
The “utm_campaign” is one of the three main dimensions that comprise a UTM tag (the others being utm_source and utm_medium). This helps you to identify a specific product promotion or strategic campaign. For example, utm_campaign=spring_sale
Source
“utm_source” is the second one, which is important for correctly tagging your URLs. The source helps you analyze how people found your website and tells you where the campaign is coming from. It can help, for example, to identify if someone clicks on a link in a newsletter “utm_source=newsletter,” search engine “utm_source=google,” or any other place where you’re running a campaign. Combined with the next one, “medium,” you can get even more granular insights.
Medium
The last one you need is “utm_medium.” Medium can tell you how the message was communicated to the visitor. For example, “utm_medium=cpc” for a cost-per-click campaign or “utm_medium=affiliate” for an affiliate link.
Term
The “utm_term” and “utm_content” parameters are not mandatory but, if used, can give you a little bit more extra insights. For example, the “utm_term” parameter tracks your keywords during a paid Ads campaign. You can also use it in your display ad campaigns to identify aspects of your audience. For example, “utm_term=running+shoes”
Content
“utm_content” is finally used when running A/B tests on your ads. It is a useful metric that can pass details about the version people clicked on and as a result, can help you determine which version is more effective than the other. For example “utm_content=logolink” or “utm_content=textlink”
Turning Google Analytics into valuable, actionable information
Being able to collect all of this data on how your content performs is excellent, but at one point, it can become a bit overwhelming.

Do you know exactly what to look for when you read analytics data? Let’s take a look at how we can optimize data and make the most out of it into valuable, actionable information.
Using Real-Time Reporting in Google Analytics 4
One of the most powerful features of Google Analytics 4 is its Real-Time Reporting, which allows you to monitor user activity on your website or app as it happens. This feature is especially useful during live campaigns, product launches, or content updates, enabling you to assess performance and quickly adjust.
What Can You See in Real-Time Reports?
GA4’s real-time report provides insights such as:
- Active users currently on your site or app.
- Top-performing pages or screens being viewed in real-time.
- User locations and demographics (if enabled).
- Traffic sources driving users to your site.
- Event data include button clicks, form submissions, or video plays.
How to Use Real-Time Reports
- Navigate to the Reports section in GA4.
- Under “Life cycle,” select Real-time.
- Observe:
- The number of active users in the last 30 minutes.
- The geographic distribution of your audience.
- Events and conversions happening live, such as purchases or sign-ups.
Why Real-Time Reporting Matters for Content Marketing
- Immediate Feedback: Launching a new blog post or campaign? Real-time reports let you see if users engage with your content and where it originated.
- Quick Adjustments: If you notice low engagement or high bounce rates, you can immediately change your landing pages or content strategy.
- Event Monitoring: Track key actions, like clicks or downloads, as they happen, ensuring your events and conversions are correctly configured.
By leveraging real-time data, you can ensure your content marketing efforts meet expectations and make proactive adjustments to maximize success.
Setting up conversions for important conversions on your site.
Setting up Google Analytics 4 for the first time is more than just adding the tracker to your website.
You need to start setting conversions to get the most out of your installation. However, how conversions are tracked has changed from what it used to be in Universal Analytics. An example is how key events have replaced goals to offer greater flexibility when setting up conversions.
Key events allow you to see how many visitors are taking action and converting into leads, subscribers, and customers. You can see what traffic sources are sending visitors that are most likely to convert and which pages are the most convincing.
What are key events?
According to Google, a key event is an event that measures how well your site or app fulfills your target objectives. Google Analytics 4 is event-based and not hit-based like Universal Analytics. A key event represents a completed activity representing a conversion in Google Ads, providing a consistent metric of how an event contributes to the success of your business.
All tracked user actions are called events and become key events when marked as one for content performance reports. Examples of events you can mark as key events to appear as conversions in Google Ads include making a purchase (for an e-commerce site), completing a game level (for a mobile gaming app), or submitting a contact information form (for a marketing or lead generation site).
Defining and marking key events to monitor conversions is fundamental to any digital analytics measurement plan. Having properly configured key events allows Analytics and Google Ads to provide you with critical information, such as the number of conversions and the conversion rate for your site or app. Without this information, evaluating the effectiveness of your content marketing analytics tools and online business is almost impossible.
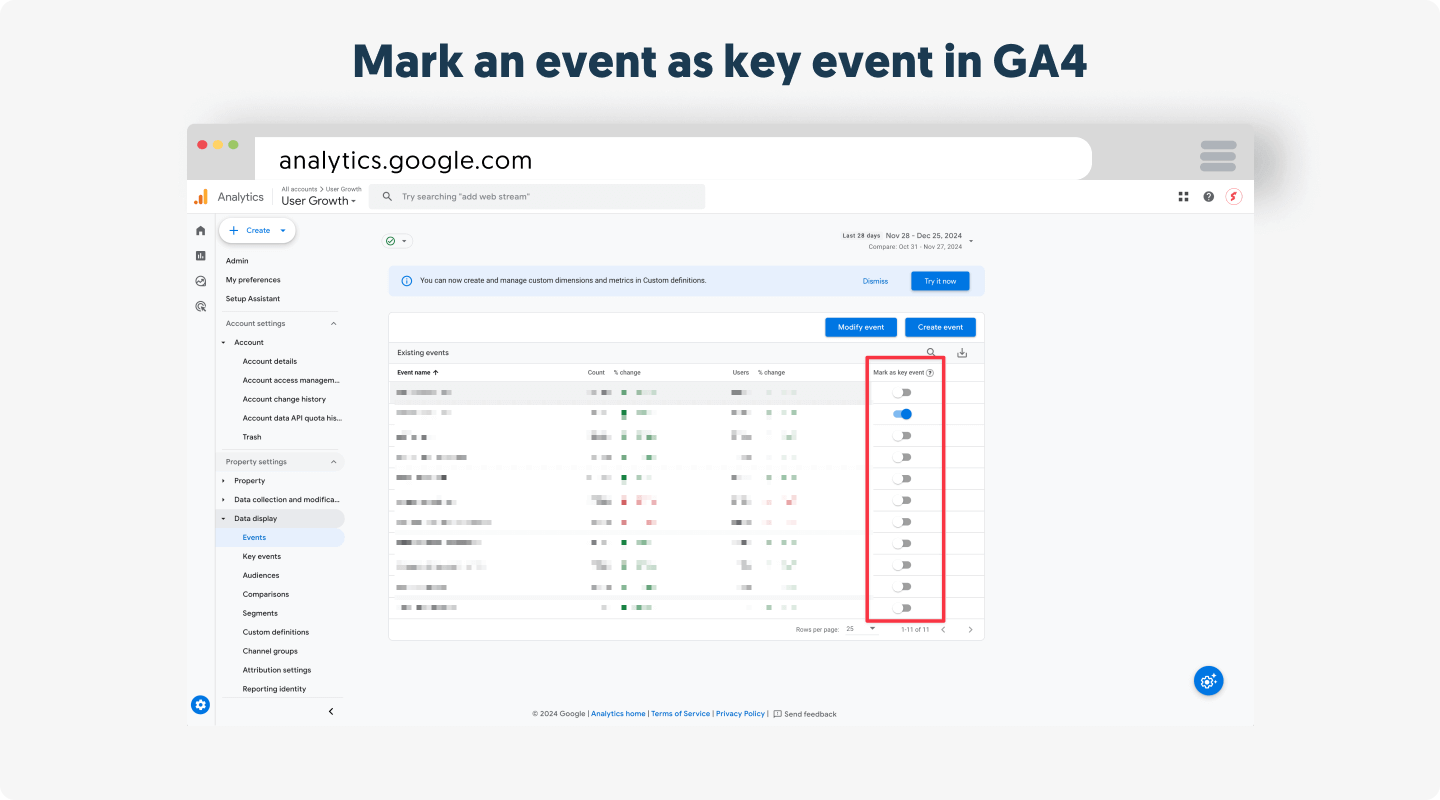
To classify an event as a key event, go to “Data Display” under the GA4 Admin panel. Then locate “Events” and use the “Mark as key event” toggle. You can also create new key events if needed, and Analytics will consider them as conversions.
What are Conversions?
Based on the latest Google updates, a Conversion is now a meaningful action you can use to measure how well your business is meeting digital marketing objectives and the performance of ad campaigns.
Previously, conversion data on Universal Analytics was always different from what was obtainable under Google Ads. Replacing goals by events and key events represented as conversions in GA4 allows an aligned definition and consistent measurement of conversions in both Google Ads and Analytics reports. It helps avoid the discrepancies that used to occur with UA. So, we have:
Events → Key events → Conversions
There is no need to change your setup if you previously used to export conversion reports from Analytics to Google Ads. Moving forward, you will have to start creating conversions within Google Ads based on the key events you marked within Analytics.
There are four different types of conversions you can use to improve your content marketing analytics:
| Goal Type | Description | Example |
|---|---|---|
| Destination | A specific location loads | Thank you for registering! web page or app screen |
| Duration | Sessions that lasts a specific amount of time or longer | 10 minutes or longer spent on a support site |
| Pages/Screens per session | A user views a specific number of pages or screens | 5 pages or screens have been loaded |
| Event | An action defined as an Event is triggered | Social recommendation, video play, ad click |
Setting up conversions requires that you first determine what is essential for your business. What key events do you want your visitors to achieve on your site?
Here are a few ideas that might get you started:
- Email list sign-ups
- Webinar registrations
- White paper downloads
- Contact form completions
- Views of a specific page
Don’t go too crazy, though; Google Analytics 4 limits you to only 30 key events per property (and 50 for Google Analytics 360), which is for a good reason.
Every key event you track will add an extra column in many reports. Too much data will make you lose sight of your primary objectives. Start with one or two, and slowly add more over time when you think they are needed.
To create a new “key event,” click on “Admin” in the left panel, then in the “Data display” column, click on Events. Next, click on Create event followed by Create.
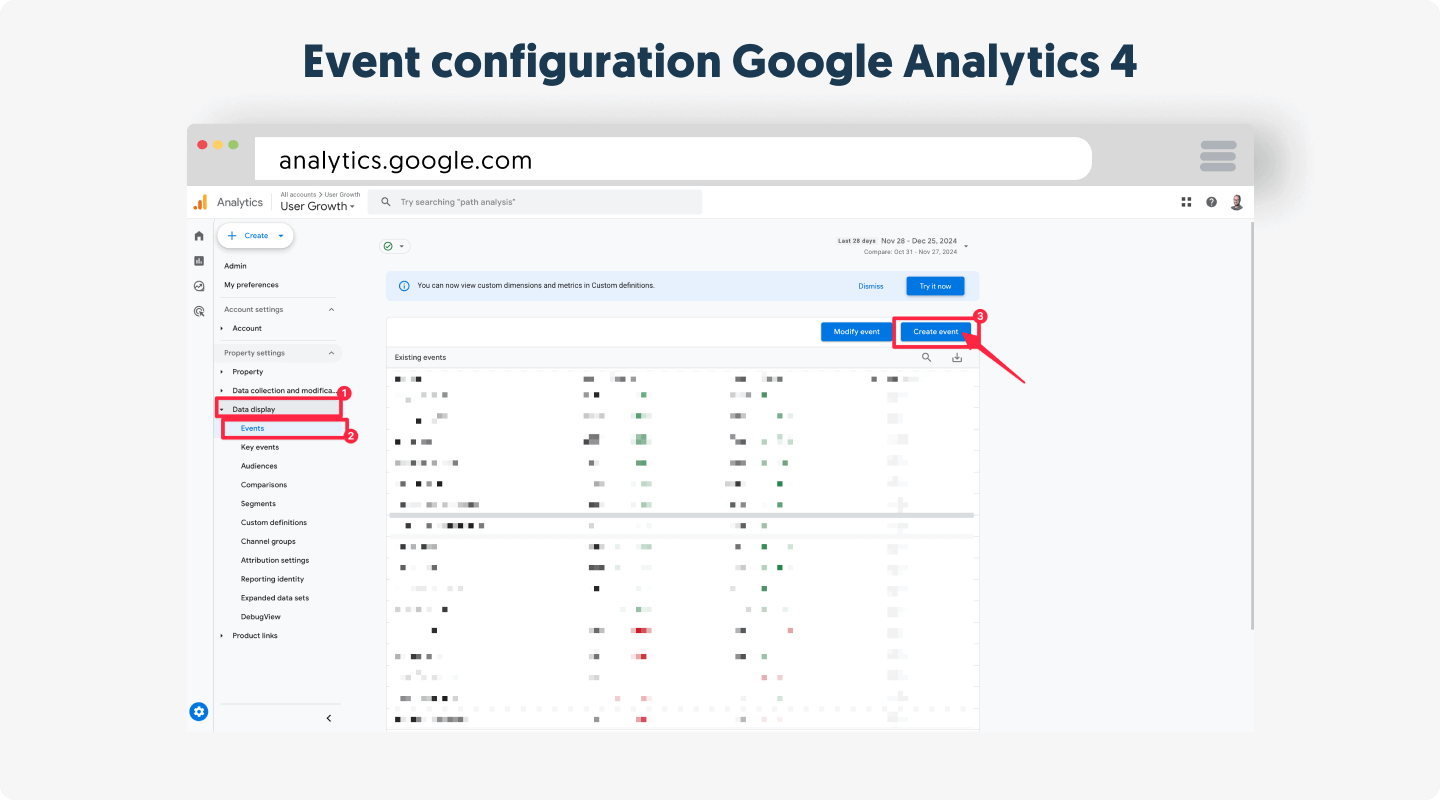
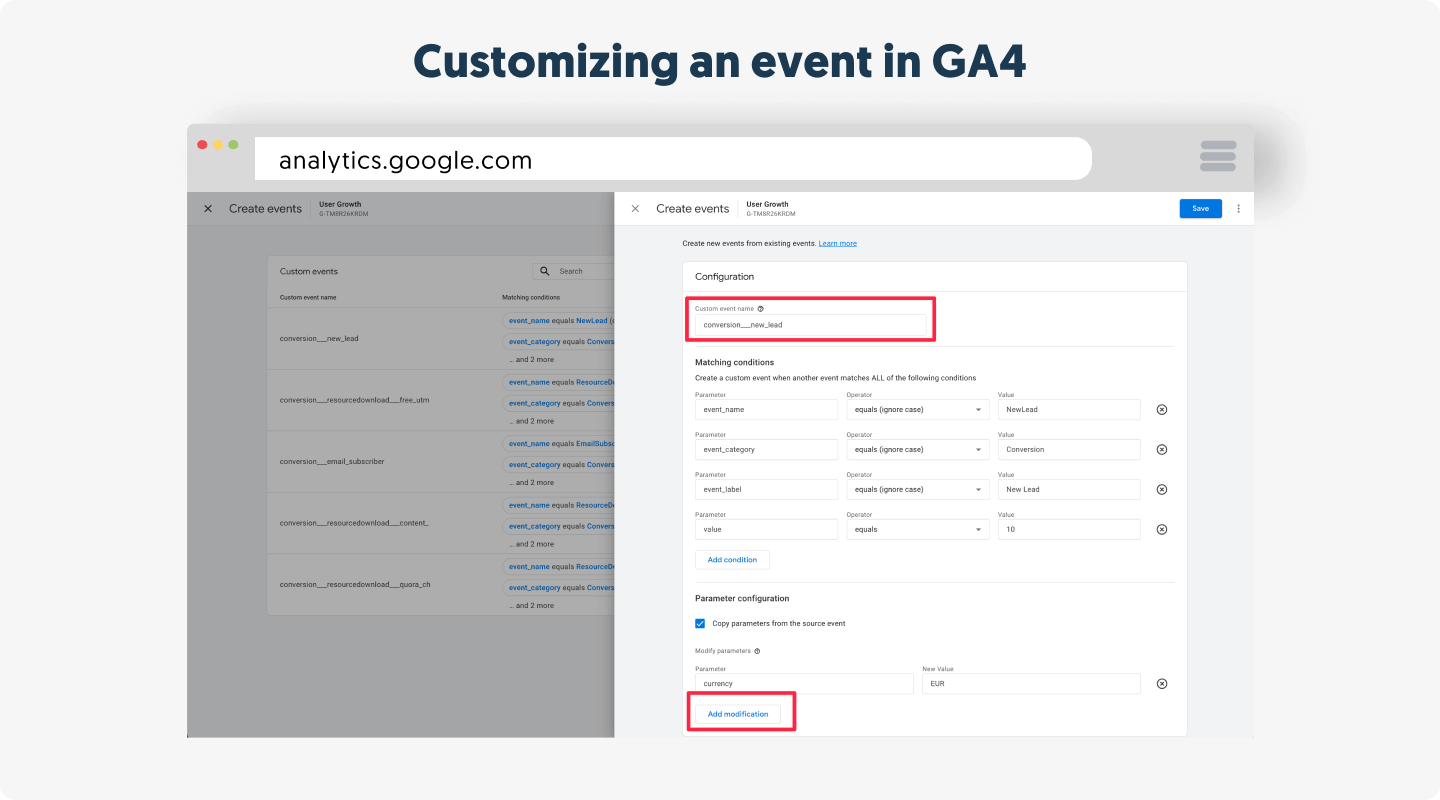
From the window that opens, enter “generate_lead” as the Custom event name. The next steps involve filling out the Matching conditions. Under Parameter, type “event_name”, leave the Operator as “equals”, and enter “page_view” as the Value for that condition row. Click Add condition once you are done, and you will see another row for Matching conditions.
Now, enter “page_location” as the Parameter, leave the Operator as “equals,” and enter “https://www.example.com/contact-us-submitted” as the Value for that new condition row.
Now, we move to Parameter configuration and click Add modification” two times to get two rows for parameter values. For the first row, enter “value” as the parameter and set the New Value entry to ‘100″ (or the value that makes sense for your business).
For the second row, enter “currency” as the parameter and set the New value entry to “EUR” (or USD, or whatever your local currency is).
Click Create when you are done.
You can mark the new event as a key event by simply flipping the switch in the last row, Mark as key event.
For most of your key events, you want your visitors to arrive at a specific destination. After all, when someone converts, they end up on a “Thank You” page, which is considered a conversion.
Creating redirects to pages like this can quickly be done within a tool like Inbound Rocket by setting up the form type to post and going to a specific page afterward.
The slug of this page is the destination you need to enter as the Destination URL in your key event, and you’re all good to go.
Aligning your goals across the Customer Journey to what you can track
Understanding your customers, Customer Journey is crucial if you want to develop content marketing efforts that work and deliver results. Thankfully, Google Analytics offers many powerful functions to measure customer behavior and marketing trends, allowing you to learn from this and respond accordingly.
Your content resonates with your target audience when you understand how they behave and what they are looking for at every stage of their journey.
Now that you know how to set up key events for conversions, let’s start aligning your goals with the different phases of the Customer Journey so that you can track your entire conversion funnel.
Topics and reports to think about here are:
Awareness
- Traffic by Channel/Medium
- Traffic by Content Grouping
- Traffic by Author, Topic, Word Count, Date Published
Engagement
- Content Downloads
- Watched Video
- Newsletter Signups
- Email marketing traffic
- Retargeting Trafic
Conversion
- Lead & Contact Forms
- eCommerce Transaction
- Average Order Value
- App Downloads
- Software Trials
- Conversions by Content Type
Retention
- Repeat Revenue
- Content consumption by logged in Users
- Product Reviews
By using the reports Google Analytics 4 has combined with custom key events, you can understand your potential customers or leads better and more effectively, steer them in the direction of a satisfied customer, and keep them there.
Using Site Search
One of the easiest ways to help your visitors and keep them on your site is by offering a search bar. There can also be a time when your site is somehow not optimized enough, and they can’t find what they are looking for; a search bar is the right tool to help them stay on your site. On top of that, it can also provide valuable insights for you.
Google Analytics can help you tap into this data through its on-site search reporting. This feature lets you quickly review which keywords people are searching for on your site.
You might be targeting the wrong keywords, and your visitors use different keywords to describe their problems.
They are used to compare what you initially thought to the search terms. You can identify if you’re on the right track.
Or maybe there is a missed opportunity to tailor your content ideas to targeted needs? After all, you know exactly what your customers are searching for, so it can identify future content you can create to drive more traffic and build more engagement.
When set up correctly, you can use the information to:
- Target the search result pages with specific campaigns (especially if they are converting well)
- Create better internal links so that the high-traffic pages allow the delivery of more traffic to lesser-performing pages
- Restructure your website to make specific content more accessible to find
- Identify topics and keywords you can use to create content
Setting this up correctly is quite easy in Google Analytics, especially with the automatic search tracking enabled within GA4. But we first need to confirm the value that defines our Query Parameter. The “query parameter” is the letter that appears in the URL to identify a search is happening. (Like the UTM tags).
Try testing your website’s search tool to see how the URL looks when you search for something. You can do that by typing a word into the search bar and clicking search. Observe if the URL changes along with a page reload, and identify the query parameter, too. A URL like mysite.com/?s=keyword is usually the default for websites running on WordPress.
In such cases, the query parameter is the letter “s” that appears immediately after the question mark “?”.
To properly set up Site Search, click on Admin in the left panel. Under the Property column, click Data Streams and select the web data stream for your site. Next, scroll down to the Enhanced Measurement section and confirm that the toggle button in front is enabled. Then, you click on the gear or settings-like button and confirm that Site Search is enabled among the options.
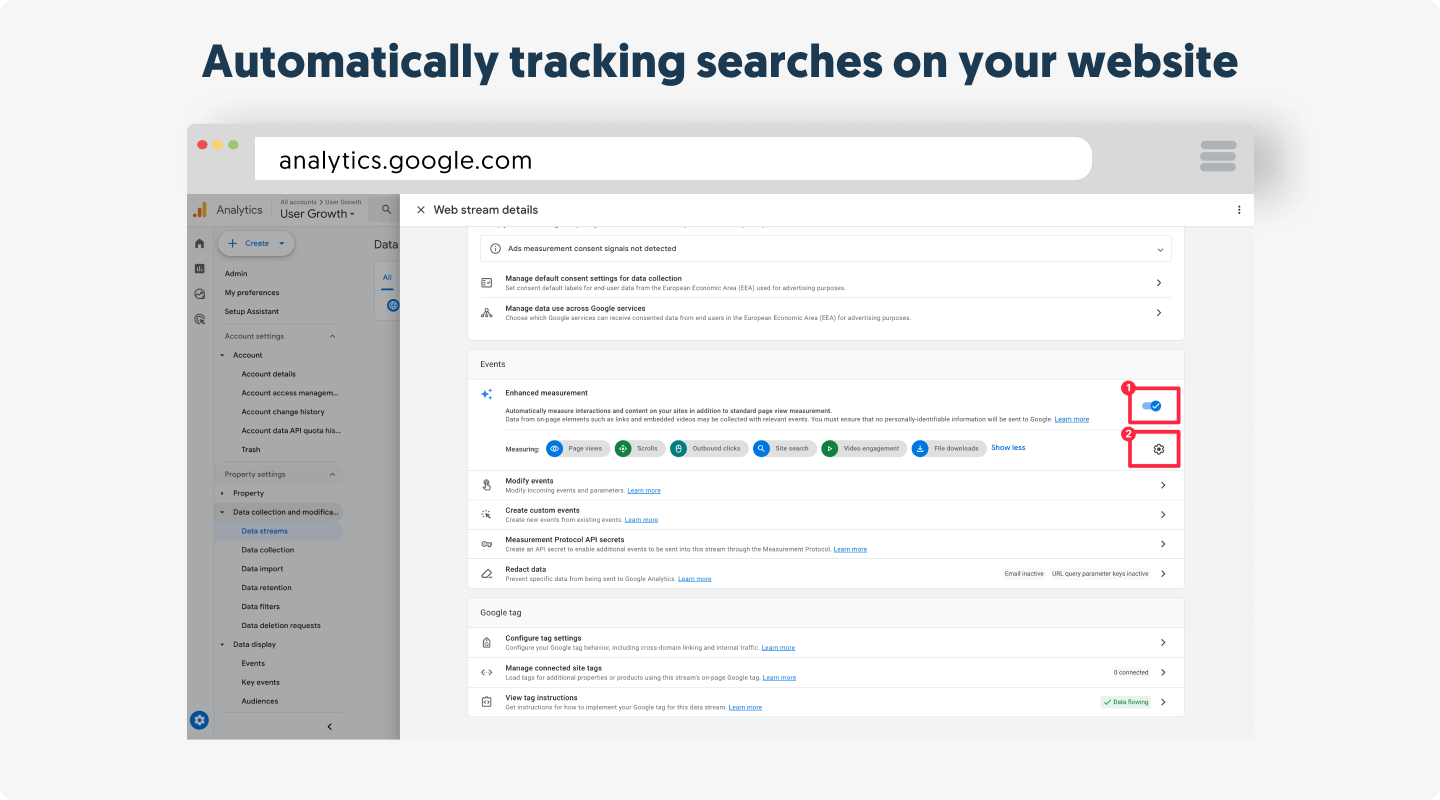
The last step is to configure the query parameters for your website. Click the “Show Advanced Settings” option under Site Search to see 5 Search Term Query Parameters used as default “q,s,search,query,keyword”. Your query parameter should be from that list, or you can specify up to 10 Additional Query Parameters.
Hit save when you are done, and use the DebugView of GA4 and view_search_results event to track your search reports.
![]()
Identifying and Filtering Internal Traffic from Google Analytics
Depending on the size of your business, employees browsing your website can cause severe issues in your Google Analytics reporting. People at your company don’t act like typical visitors on your site and, as a result, alter the metrics that are reported most of the time, like users, sessions, and Pageviews.
On top of that, they affect probably the most important metrics for your organization, the conversion rate and attribution reporting in your goals. These can directly impact budgeting, bid strategies for ads, and all sorts of other business decisions for content marketers.
The best content marketing analytics solution is to create a filtered view within GA4 so that these internal visits do not mess up your data.
The easiest way to do this is to create an IP address filter in Google Analytics. But before you can do that, you first need to figure out what your IP address is.
Just head over to https://www.whatismyip.com/ or do a Google search for “what my IP address is.”
Now we go to our Google Analytics, choose Admin in the left column, and then from Property Settings, select Data Streams. Then, choose the Data Stream you want to filter, click Consent Settings, scroll down, and select Configure tag settings under Google tag. Next, you select the “Show more” option and locate “Define internal traffic” from the list under Settings.
To create an internal rule for new traffic, click on Create. You can give your Filter a name like “Internal Traffic Filter”, and set the IP address condition to “equal to” or “contains”, depending on your preferences. You should also find an input box below. Enter the IP address you found earlier, and click Create to save this new internal traffic rule.
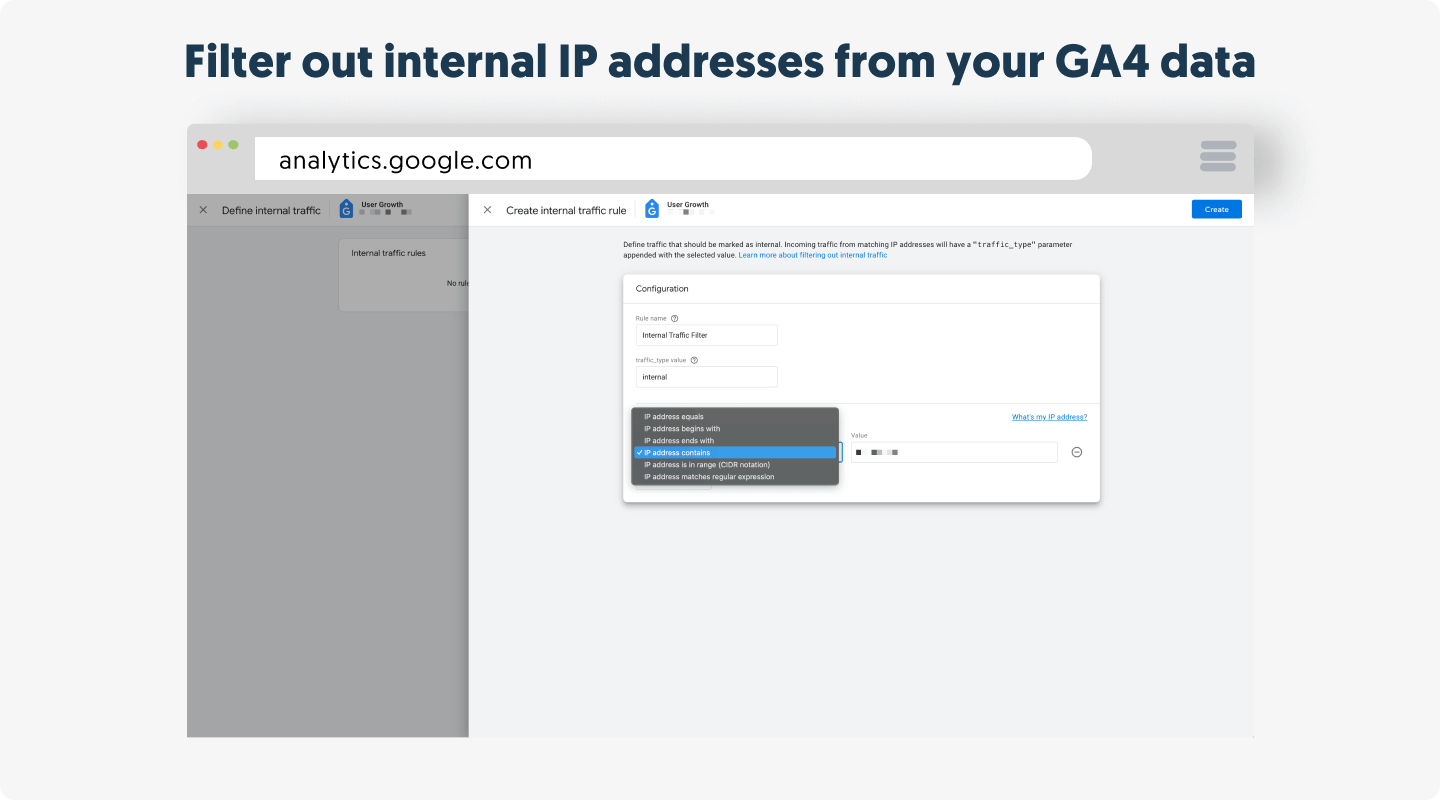
From now on, all internal visitors within your company will be entirely ignored.
If you still want to be able to make sure that the original data is still saved, the best thing to do before setting up a filter is to create a new view just for this filter. This way, you will have the raw data and filtered data available for you. To do that,
- Click “Admin” and navigate to Data Filters under “Data Collection and Modification.”
- You should see the Internal Traffic filter here. Click on it, then initially set the filter state to Testing to confirm if it works correctly.
- After verifying that the filter correctly excludes internal traffic, switch the filter state from Testing to Active to fully apply it to your reporting data.

This process ensures that traffic from specified IP addresses is effectively removed from your GA4 data.
See which pages hold people’s attention the longest.
The report that probably holds the most important clues about which existing content your visitors love is the “Average Time on Page” report that used to be in Universal Analytics. In some ways, this is a more accurate measurement of interest than the report on which pages get the most traffic. Especially if you’re running an advertisement campaign going to a specific page or when some of your pages are ranking well and driving in a ton of organic traffic.
The new GA4 update uses the “Average Engagement Time” instead to get insights similar to the “Average Time on Page”.
To see the “Average Engagement Time” and rank your pages according to the time spent on them, go to Reports on the left sidebar of your Analytics dashboard. Locate Engagement and select Pages and Screens.
The available report will show the various data for each page or screen in your property. The “Average Engagement Time per User” column reflects the average time users actively engage each website page.

Another interesting content marketing metric to report is the Page Value, but GA4 does not measure this directly as with UA. However, there are alternative ways to do that. In the “Pages and Screens” report, you can add columns such as “Event Count” to track conversions related to specific key events like clicks and downloads for each page. You can also set up events such as “purchases” to track monetary values for e-commerce reporting in GA4.
Finding slow loading page to optimize your site speed
The last report we want to focus on here is the report identifying slow-loading pages. According to Google, most websites are too slow.

2 seconds is the threshold for e-commerce website acceptability. At Google, we aim for under a half second.” Maile Ohye – Google
In other words, when most websites rank above nine seconds, your visitors are already gone before seeing your content.
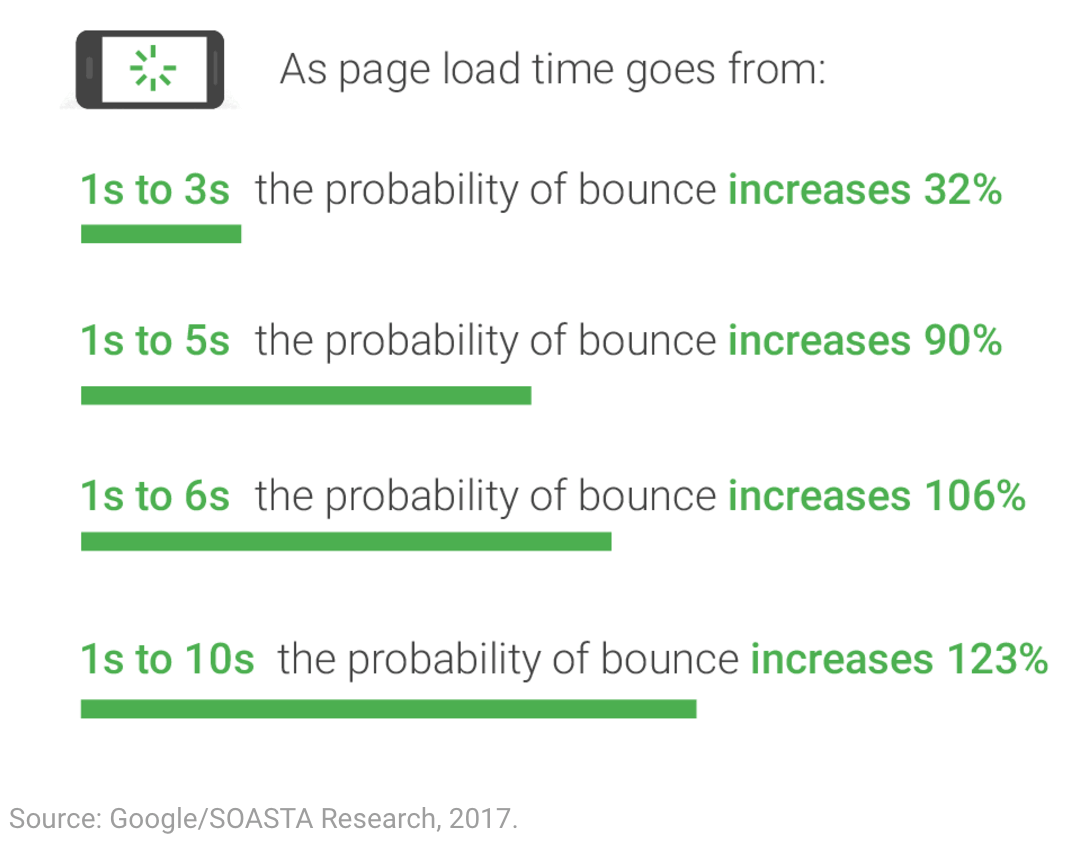
As of July 2018, page speed is a ranking factor in mobile searches.
Thankfully, there are GA4 custom events and the Google’s PageSpeed Insights that you can use to figure out which specific pages are loading the slowest and need improvement. The GA4 custom events include Core Web Vitals such as Cumulative Layout Shift (CLS), Largest Contentful Paint (LCP), and Interaction to Next Paint (INP) that can be imported to Analytics using Google Tag Manager or using code.
Identifying the pages with the most traffic helps you know which pages you need to optimize first.
Finding Slow-Loading Pages and Tracking Core Web Vitals
Tracking Core Web Vitals in Google Analytics 4
While identifying slow-loading pages is crucial, Core Web Vitals provides a more comprehensive understanding of user experience metrics that impact your website’s performance and SEO. These metrics include:
- Largest Contentful Paint (LCP): Measures loading performance, representing the time it takes for the largest visible content element (e.g., an image or text block) to render fully.
- Interaction to Next Paint (INP): Replaces First Input Delay (FID) and evaluates responsiveness by considering all user interactions throughout the page lifecycle rather than just the first interaction.
- Cumulative Layout Shift (CLS): Monitors visual stability, measuring unexpected layout shifts during page load.
Why Core Web Vitals Matter
Google uses Core Web Vitals as a ranking factor, meaning they directly impact your site’s visibility in search results. Tracking these metrics alongside user behavior in GA4 provides actionable insights to improve both performance and engagement. For example:
- Poor LCP can deter users if pages take too long to load.
- High CLS frustrates users with unstable layouts.
- Low INP ensures the site feels responsive and smooth.
Setting Up Core Web Vitals in GA4 via GTM
1. Create a GTM Container
- Log in to Google Tag Manager and open your existing container.
- Add a new Tag by clicking “Tags” and then “New.”
2. Add Core Web Vitals JavaScript
- Use the Web Vitals Library from Google’s Core Web Vitals JavaScript.
- Implement the script in a Custom HTML Tag. Example:
<script>
 new PerformanceObserver((entryList) => {
 for (const entry of entryList.getEntries()) {
 const metricName = entry.name; // LCP, CLS, INP
 const metricValue = entry.value;
 window.dataLayer.push({
 event: "core_web_vitals",
 metric_name: metricName,
 metric_value: metricValue,
 });
 }
 }).observe({
 type: ["largest-contentful-paint", "cumulative-layout-shift", "event"],
 buffered: true,
 });
 </script>
3. Set Up Variables in GTM
- Create Variables in GTM to capture the
metric_nameandmetric_valuefrom the data layer:- Variable Name: Metric Name
- Data Layer Variable Name:
metric_name - Variable Name: Metric Value
- Data Layer Variable Name:
metric_value
- Create Variables in GTM to capture the
4. Create Events in GA4
- Navigate to Admin > Events > Create Event in GA4.
- Create custom events for each Core Web Vital:
- Condition:
metric_nameequalsLCP,CLS, orINP. - Assign appropriate metrics to track Core Web Vitals in real time.
- Condition:
5. View Core Web Vitals in GA4
Once set up, these metrics will appear in your event reports under the Events section. This integration gives insights into how page performance correlates with user engagement and conversions.
Using Core Web Vitals Data
By combining Core Web Vitals with GA4 engagement metrics, you can:
- Pinpoint high-traffic pages with poor performance to prioritize optimization.
- Assess how loading time and responsiveness affect conversion rates.
- Focus on optimizing pages with both high engagement and poor Core Web Vitals scores for the greatest impact.
For example:
- A product page with poor LCP may drive users away before they see key content.
- High CLS on a blog page can frustrate users, leading to a higher bounce rate.
- Low INP ensures smooth interactions on critical pages like checkout or forms.
Advanced Google Analytics reporting
The final item we want to focus on is a bit more advanced but can give you great insights into finding your most popular content based on the categories and the associated tags.
The way to do that is called Content Grouping. According to Google, Content Grouping is:
Content Grouping lets you categorize content (pages and screens) into custom structures that reflect the context of your site or app, allowing you to view and compare aggregated content marketing metrics by group name and detailed analysis such as the individual URL, page title, or screen name. For example, you can see the aggregated number of Pageviews for all pages in a group like Men/Shirts and then drill in to see each URL or page title.
So, how to use Content Grouping to determine your most popular content?
Using Content Grouping to determine your popular content
There are four different methods of configuring content grouping, depending on your preference and technical knowledge.
- Using a RegEx Table within the Google Tag Manager (GTM)
- Using Google Tag with URL parameters
- Using the Data Layer with the help of a developer
- Using screen_view event for Firebase SDK
The first method is our preferred choice in this guide, especially since it does not involve code or finding a web developer to help you push values, unlike the Data Layer method. Also, the last method will only work if you are using the Firebase SDK integration.
Follow these steps if you want to configure content groups on your own using a RegEx table within Google Tag Manager:
1. From your Google Tag Manager workspace, click Variables on the left side. Two variable sections will open, with the lower one titled “User-Defined Variables”. Click on New in that section.

2. Click on where you see “Variable Configuration” under the new “Untitled Variable” window that appears. Then, scroll down and select RegEx Table under Utilities. Remember to rename the window as “Content Group”, or choose any name you can easily recognize.
3. Select {{Page Path}} from the “Input Variable” field and click the “+ Add Row” box to create a Pattern and Output row. The number of rows you choose to add depends on how many content groups you want to see in Google Analytics.

4. The Output represents the names of your content groups, so it is advisable to carefully choose names that clearly define the sections in that group. Patterns stand for the RegEx term that defines the corresponding output. If your website has a blog post section with the URL www.example.com/blog, you can have “/blog” as the pattern and “Blog Posts” as the output.
5. Tick the “Set Default Value” box and assign “Other group” as the default value for instances where the viewed URL matches none of your other content groups. (“Other group” can be replaced by any name you choose).
6. In Advanced Settings, proceed to uncheck the ticked boxes for “Full Matches Only” and “Enable Capture Groups and Replace Functionality”.
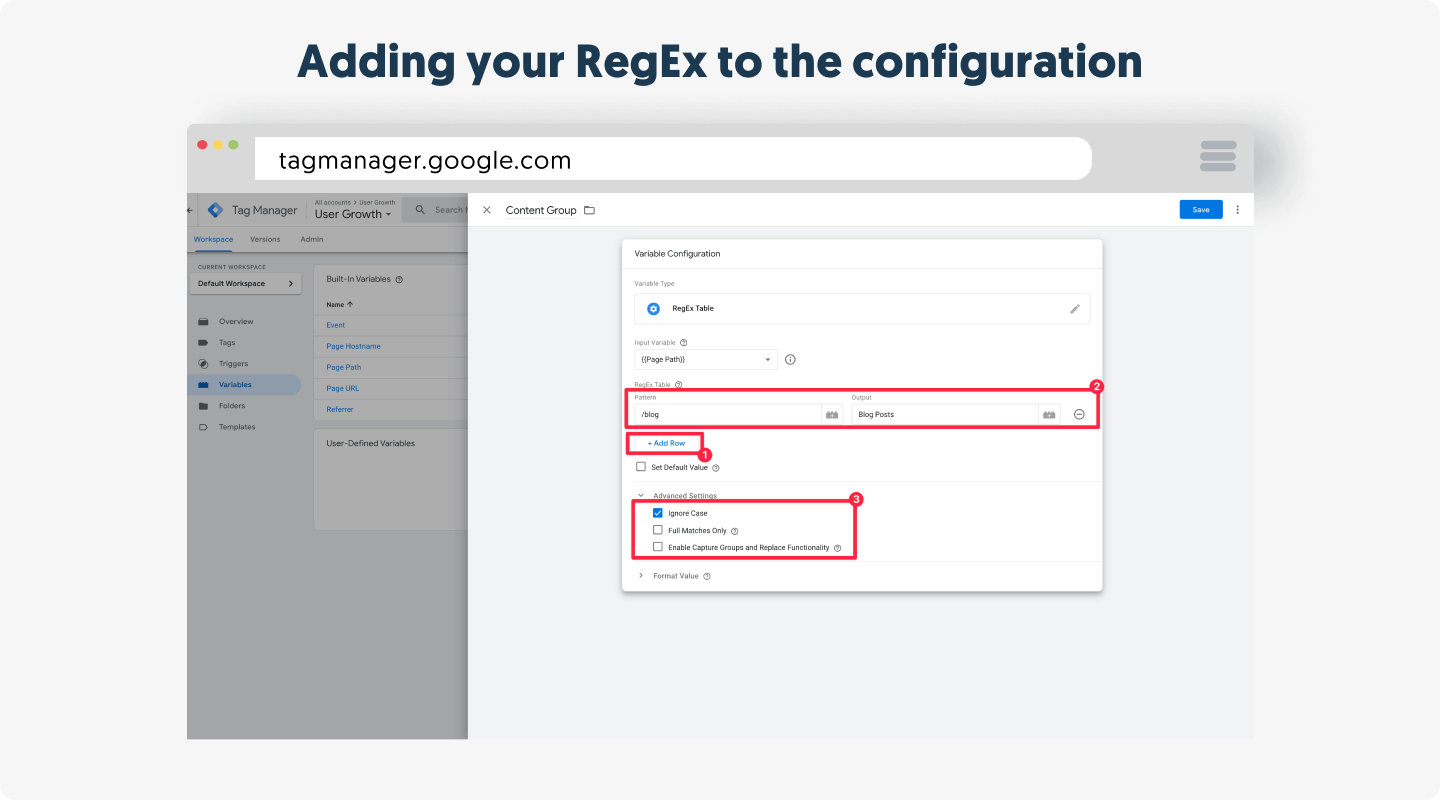
7. Save the changes to your new variable.
Next, we must add the new variable we set up to our GA4 configuration tag.
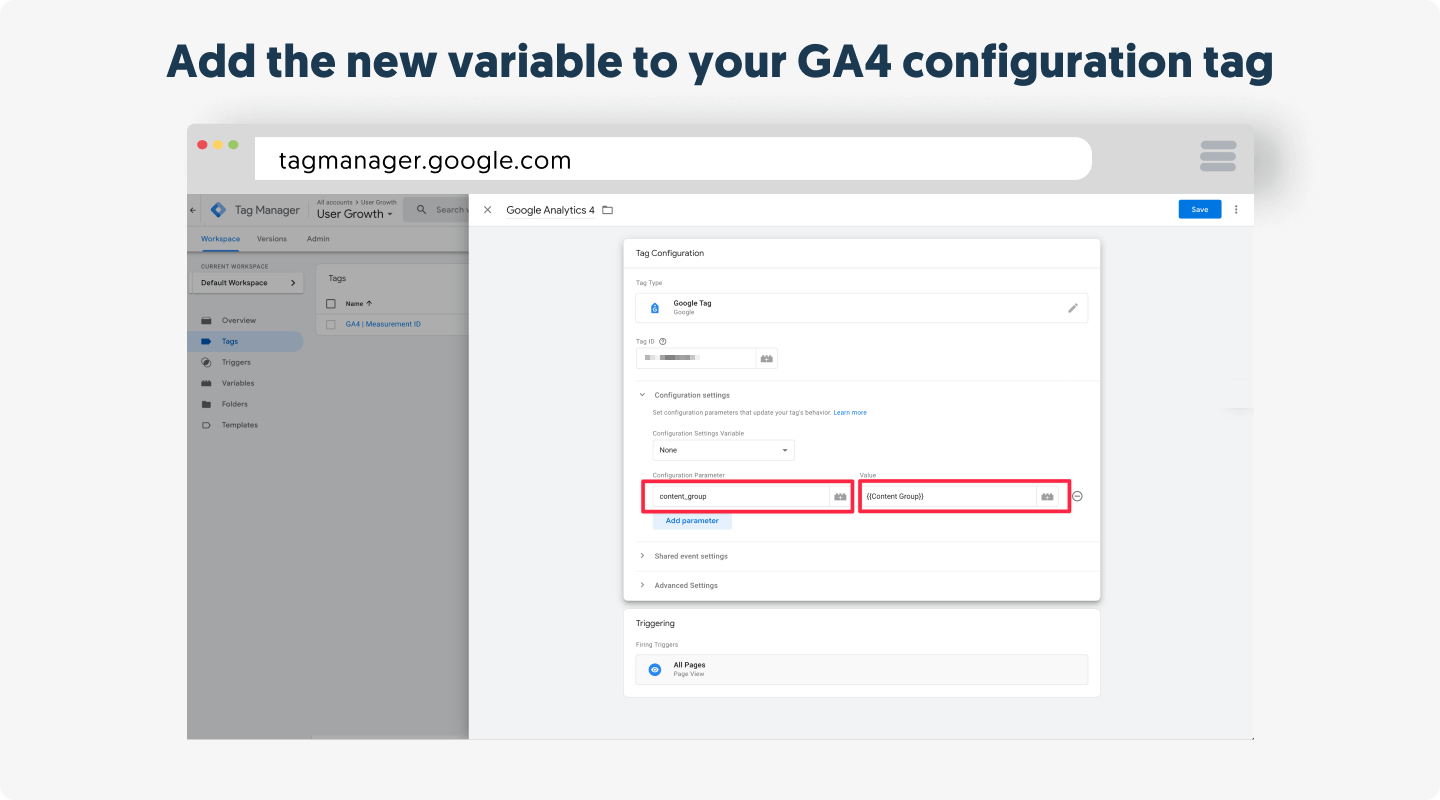
- From the workspace environment in Google Tag Manager, select Tags on the left side and locate your Google Tag.
- Open the tag and click on “Google Tag” to see the available settings. Click Configuration Settings, followed by Add Parameter under Configuration Parameter. Enter the content group with the quotation marks in the Configuration Parameter field. For the Value field, enter {{Content Group}}.

- Click Save to keep your changes, and click Submit to update the tag.
- Select the Publish and Create Version option to push the changes to your site, and click Publish.
Now, we head over to your WordPress site and go to the Google Tag Manager plugin we installed earlier. Under the “Basic data” tab, make sure that both “Category list of current post/archive” and “Tags of current post” are selected.

By doing this, we store extra pieces of information in a Data Layer on your blog posts. The post categories and tags can now be used within Google Tag Manager for more advanced data collection and reporting.
The final step will be to publish the changes you made in Google Tag Manager.
In other words, you can now figure out the most visited content on your website that visitors find most interesting. It also helps to understand how certain content performs based on the categories and tags.
Although it is a bit of a top-level view, it can be powerful to understand your top-performing content quickly. And as a result, it can help you focus on the topics your visitors love most.
Using Explorations for Deeper Customer Insights
The Explorations feature was not available in Universal Analytics and is exclusively a Google Analytics 4 update that helps with advanced reporting on users and data visualization.
While UA limited users to predefined dashboards and reporting tools, Analytics 4 allows for more customization and interactive reports.
With Explorations in GA4, you can get more detailed insights through custom paths, funnels, and visualizations. Mapping out the user journey is also much easier.
Explorations in GA4 help you solve content marketing challenges such as:
- Where exactly are visitors dropping off in the sales funnel?
- How do different audience segments overlap, and how do we create a targeted campaign based on common behaviors?
- Which user paths are most effective at driving conversions?
Techniques for GA4 Explorations
- Free form exploration: Using custom visualizations such as charts and tables to explore data insights and compare metrics.
- Funnel exploration: Track and observe how users complete specific actions or events, such as purchasing or signing up for a newsletter. Creating multistep custom funnel reports provides analysis of user drop-offs and how to optimize conversion paths.
- Path exploration: Using tree graphs to discover how users are moving around your website or app. helps identify navigation and user engagement challenges.
- Segment overlap: Visual report on the common interests and behaviors of separate user groups, such as combined data of those who read your blog and complete a contact form.
- User explorer: Analyze individual user journeys, including sessions, events, and interactions, to understand specific behaviors or troubleshoot issues.
- Cohort exploration: Use shared attributes (e.g., users from the same campaign) to effectively group users to track their behavior over time.
- User lifetime: Track user metrics like lifetime revenue, events, and retention to analyze long-term value and engagement patterns.
How to create an Exploration in GA4
1. Open Google Analytics and select the Explore tab from the left-side bar.
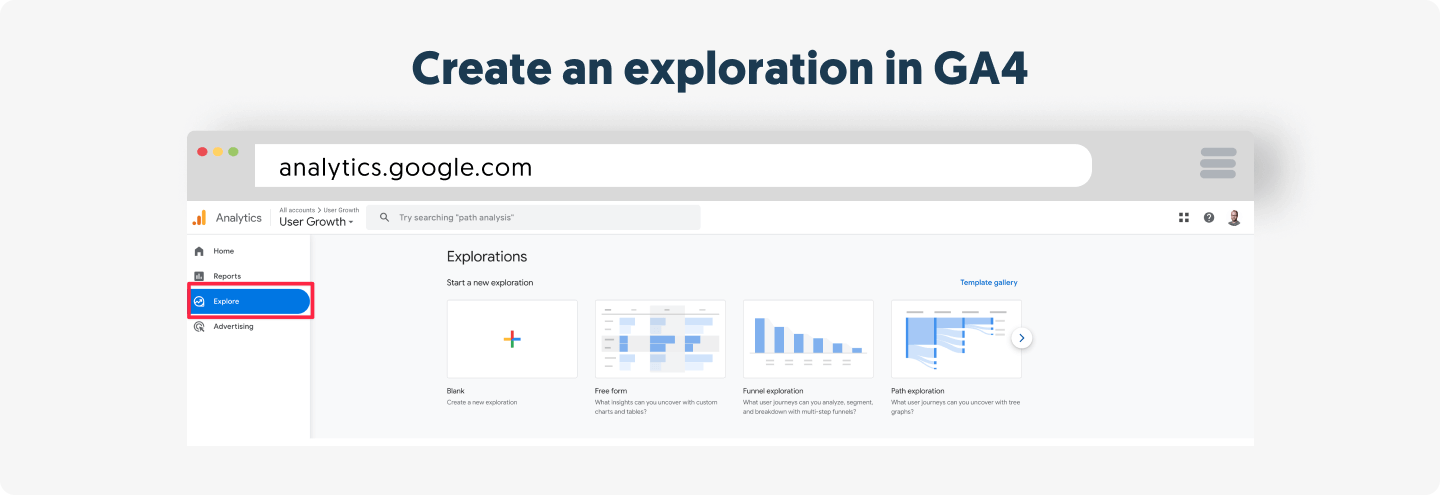
2. Select from the list of exploration techniques if you want some pre-existing data included, or select Blank to create a new exploration from scratch.
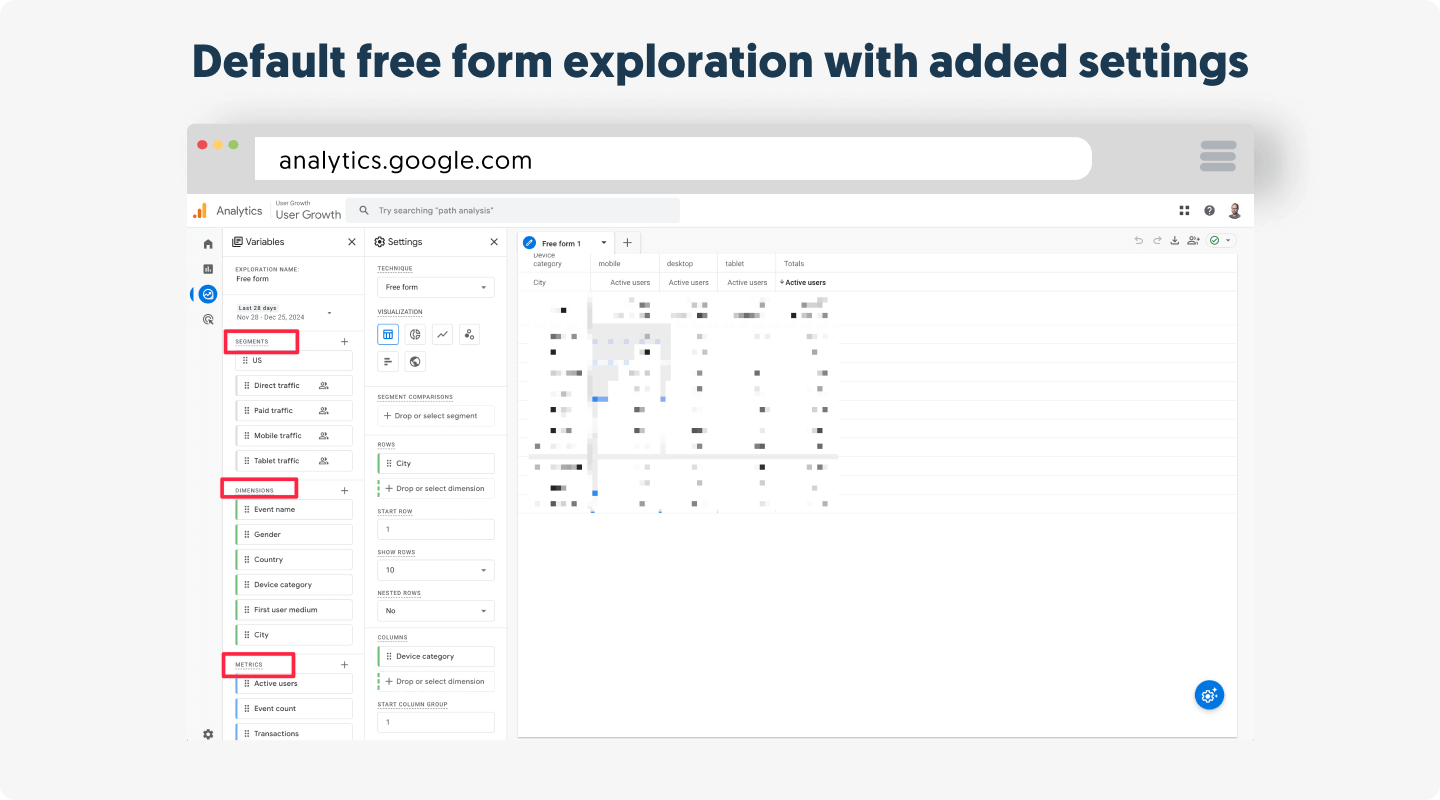
3. Free-from is the default exploration technique, as seen above. Next, we must define the data we want to explore under the Variables and Settings columns. Starting with Variables, click the “+” sign to select your target Segments, Dimensions, and Metrics data. Next, click Confirm in the top-right corner to add selected items to your exploration.
4. The Free-form exploration sheet will remain blank until you add the dimensions and metrics to the Settings column. Use the drag-and-drop method to achieve that. We made some selections, as seen in the screenshot below. Observe how the Segments feature is helpful for comparison of the same data row for different audiences.
5. You can now access your exploration report and customize it by including more items from the Variables list.
6. Name your Explorations to identify them under the Explore menu.
Setting up BigQuery export for Google Analytics 4
BigQuery export has always been available in Google Analytics but was only accessible to GA360 users. However, the migration to Google Analytics 4 has now made the formerly paid tool on UA free for all users. It is a valuable feature for in-depth analysis and extracting insights to create custom reports of specific parts of a large dataset. Correctly setting up BigQuery export can help you optimize content marketing efforts.
Follow these steps to set up BigQuery export:
1. Log in to the Google Cloud Console and create a new project or select an existing one.
2. Locate API & Services under the navigation menu in the top-left corner. Click on it and select Library.
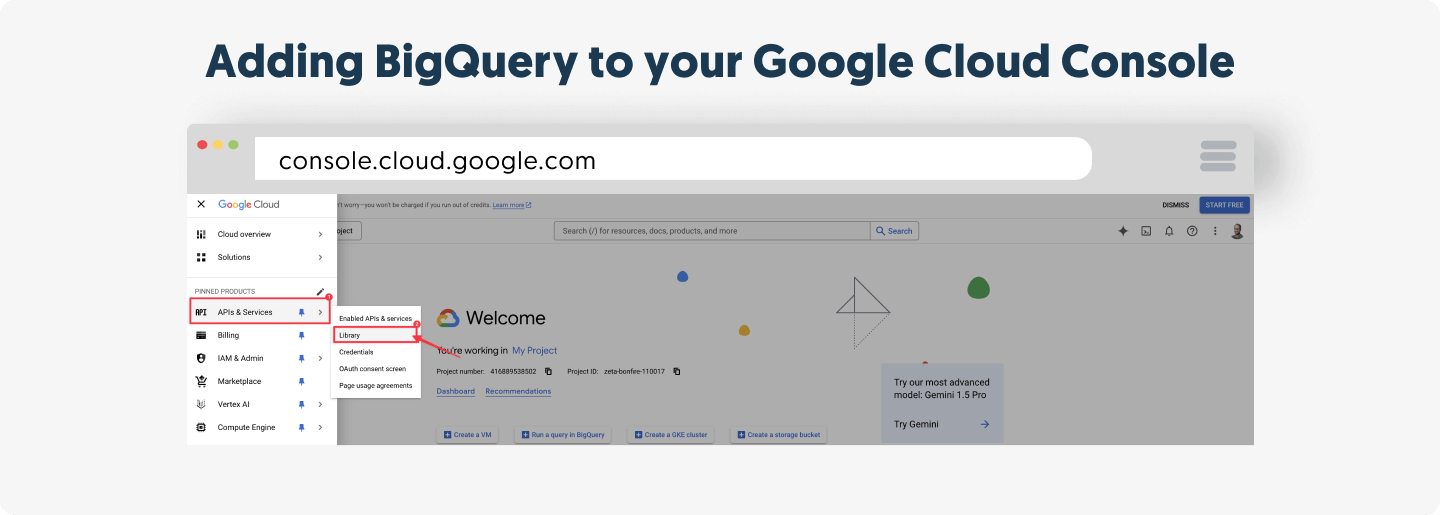
3. From the Google APIs, click Bigquery API and select Enable to activate it if it isn’t enabled by default. Alternatively, use the API Library search to find BigQuery API.
4. You might see the Terms of Service if it’s your first time setting up. Review it and agree.
Once that is done, we now have to link our Google Analytics 4 property to BigQuery.
5. Open Google Analytics again and click on Admin > Product Links > BigQuery Links. Remember that the last property you worked on is selected by default; if you changed it, you can manually change that under the “All accounts” display at the top.
6. Click Link.
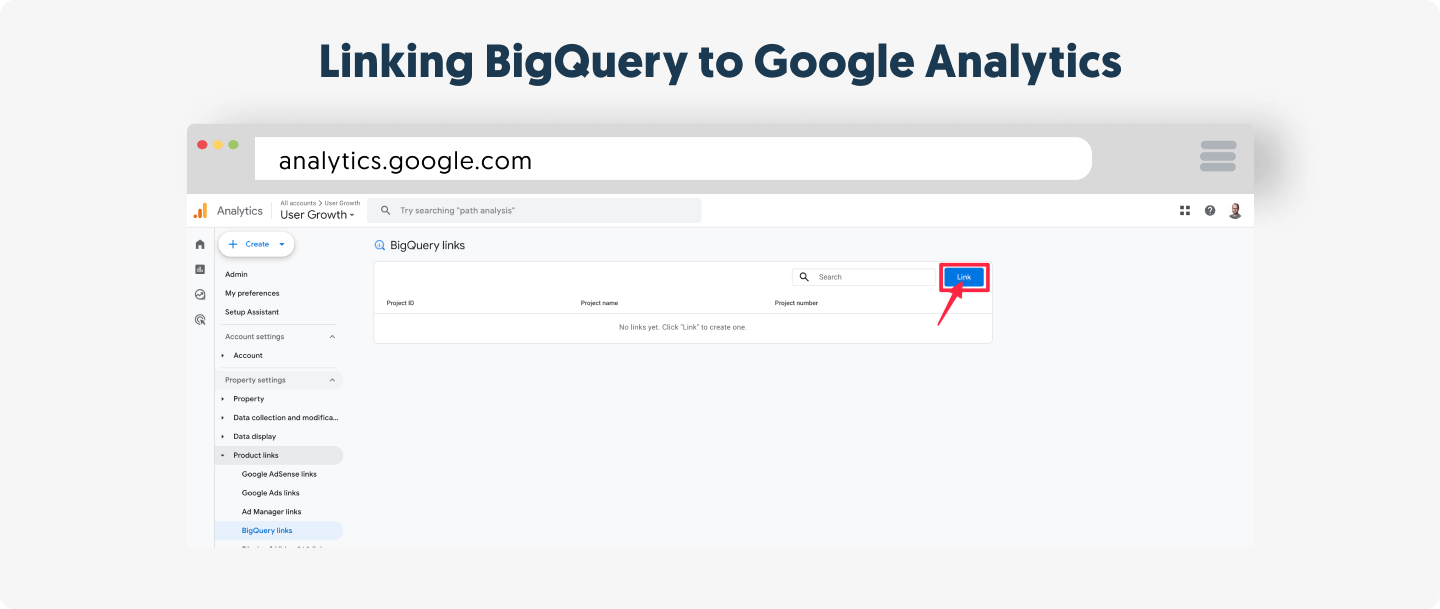
7. From the next window, select Choose a BigQuery project. A new window opens titled “Link to a BigQuery project I have access to”. Tick the box next to your project and click Confirm in the top right corner.
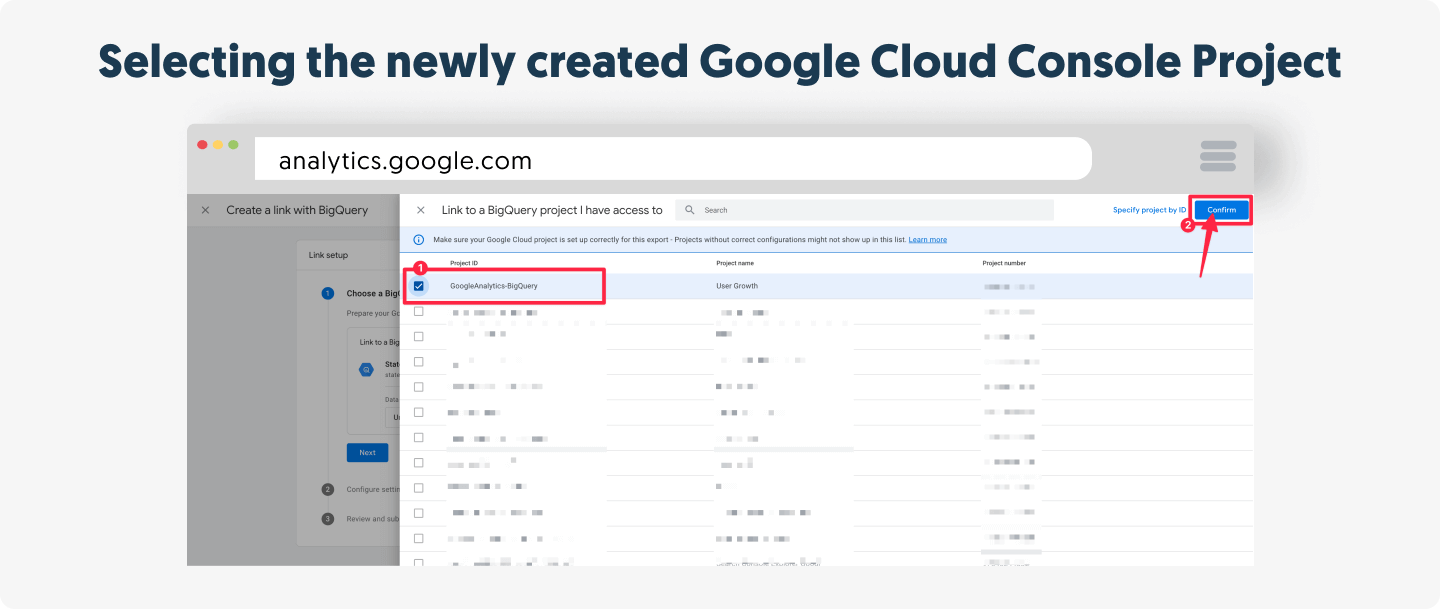
8. Choose the correct Data Location and click Next.
9. Under Configure Settings, select the Configure data streams and events option. This helps select what data streams will appear in the export and which events will be excluded. Use the Add or Specify event by name options to do that.
10. Click Apply.

11. Tick the box for “Include advertising identifiers for mobile app streams” if you want it on your BigQuery report. It’s optional.
12. Specify the Export type, whether it should be Daily or Streaming continuously. Users on Analytics 360 have an additional Fresh Daily option.
13. Click Next and finally click Submit after confirming your selected choices. Your display should look like the below screenshot when you are done.

So there you have it: Google Analytics is a treasure trove of insights that offers an unparalleled view of your website’s performance and user behavior. Best of all, it provides these invaluable tools at no cost.
However, data alone isn’t enough. Success lies in using this information to refine your content marketing strategies, connect with your audience, and drive measurable results. Whether you’re identifying top-performing pages, tracking Core Web Vitals, or delving into advanced reports like BigQuery, the true power of Google Analytics comes from turning insights into action.
So, what’s next for your content marketing? Start small by setting clear goals, exploring your data, and experimenting with the strategies discussed in this guide. Every insight you uncover is a step closer to creating content that resonates with your audience and grows your business.
How do you plan to leverage Google Analytics to elevate your content strategy? Share your thoughts or tips in the comments below—your journey could inspire others to take their next step!
